Key takeaways
- The reviewed terms do not establish faster direct cash redemption for the tokenized fund. Payment windows are commitments, not measured processing times. [4] [5]
- At an assumed 4% annual net carry difference, three additional productive days on USD 1 million are worth USD 328.77. A 10 bp fee needs 9.13 days to break even.
- Recurring use can justify infrastructure costs; collateral borrowing can meet a deadline. Both require an actual counterparty and an economic comparison with the available alternatives.
A treasury does not buy a faster ledger. It buys income on cash that would otherwise sit idle, or access to money when a payment is due. A tokenized money-market fund earns its place only when those outcomes improve after costs.
Our comparison of two Franklin Templeton USD money-market funds leads to a specific conclusion: the public terms do not establish a faster direct cash exit for the tokenized product. Its stronger economic case requires an additional use for the fund shares: settlement with an accepting counterparty, or financing against eligible collateral. That additional use must save enough capital or operating expense to pay for distribution, conversion and financing.
The distinction matters most over short holding periods. Small transaction charges can consume several days of money-market income. This paper measures that hurdle, separates documented product terms from hypothetical economics, and identifies the circumstances that would change the conclusion.
1. A comparison with a defined buyer
We study an already onboarded, non-US Singapore treasury investor with USD cash, access to both selected share classes and a USD 1 million allocation. This is a conditional comparison of product economics; it does not imply every corporate account is eligible. A retail saver starting with USD 20 faces a different access problem.
The pair is Franklin OnChain U.S. Dollar Short-Term Money Market Fund and Franklin U.S. Dollar Short-Term Money Market Fund, both A (acc) USD. Franklin explicitly describes the tokenized fund's investment objectives as mirroring the Luxembourg fund's objectives. That makes the pair more informative than comparing a tokenized bond with a money fund. [1]
| Comparison boundary | Tokenized fund | Conventional fund |
|---|---|---|
| Share-class identifier | SGXZ71843866 | LU0128526901 |
| Legal vehicle | Singapore VCC sub-fund | Luxembourg FTIF sub-fund |
| Currency / income treatment | USD / accumulating | USD / accumulating |
| Published minimum | USD 20 | USD 1,000 |
| Benchmark | Bloomberg U.S. Treasury 1-3 Month | Bloomberg U.S. Treasury 1-3 Month |
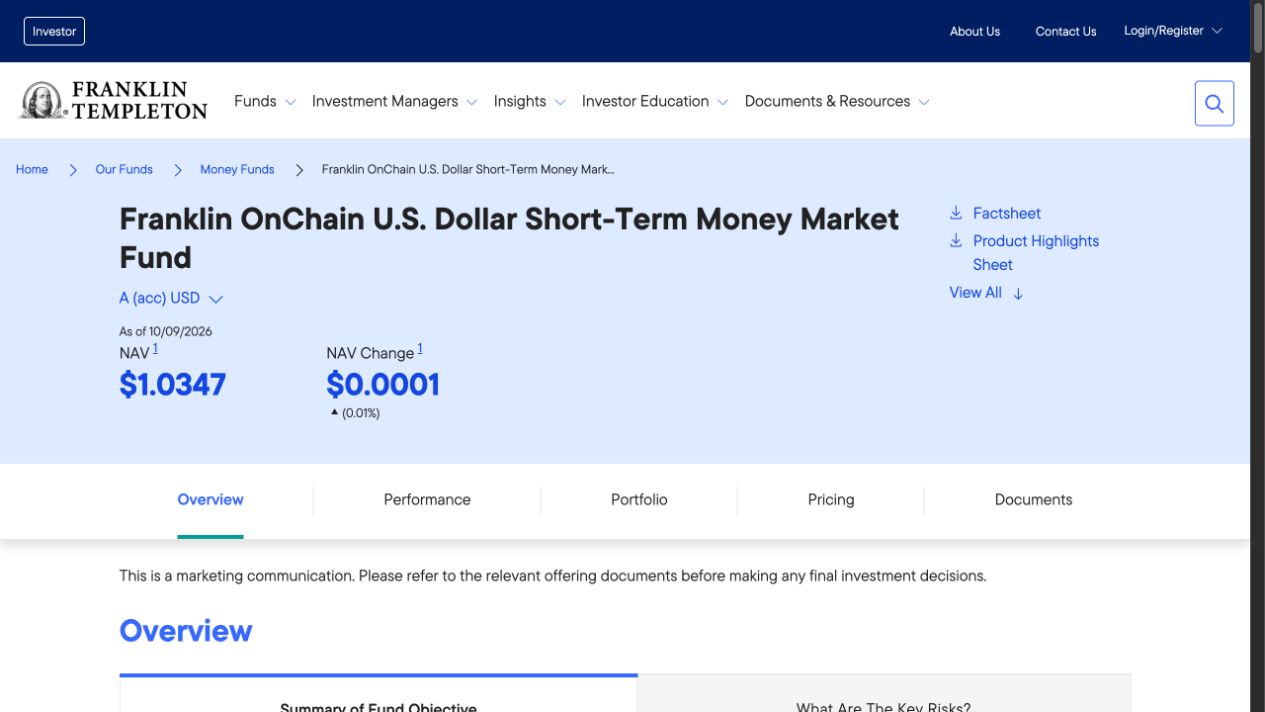
Source: Franklin Templeton Singapore ↗ · Captured September 12, 2026. The screen shows September 10 NAV; the return comparison below uses July 31 factsheets.
Identifiers, minimums and benchmark are from the July 31, 2026 share-class factsheets. [2] [3]
The funds remain separate portfolios in different legal structures. Matching manager, currency and stated purpose does not hold credit exposures, holdings or domicile constant. We therefore compare observable terms and outcomes, without attributing return differences to tokenization. We also exclude Franklin's US government money fund: a feature available to its US token holders is not evidence of the same feature for this Singapore fund.
Institutional distribution is real: Marketnode announced its appointment as an authorised distributor in March 2026. Distribution access, however, answers where an eligible customer can obtain exposure; it does not by itself supply a secondary buyer or a lending facility. [7]
2. The cash exit still has a dealing calendar
The conventional fund's May 29 Product Highlights Sheet specifies payment within one Dealing Day following the Dealing Day on which a sale request is received and accepted. Its representative's cutoff is 4 p.m. Singapore time; a later accepted request uses the next Dealing Day's valuation. [4]
The tokenized fund's May 12 sheet describes normal redemption proceeds within seven Business Days after receipt and acceptance, with requests after its 4:30 p.m. deadline carried to the next Dealing Day. Its register combines blockchain records with off-chain information. Token recordkeeping does not remove the fund's dealing process. [5]
Read the full redemption clausesProduct Highlights Sheets · Page 4 of each document
The dealing window, in the fund documents

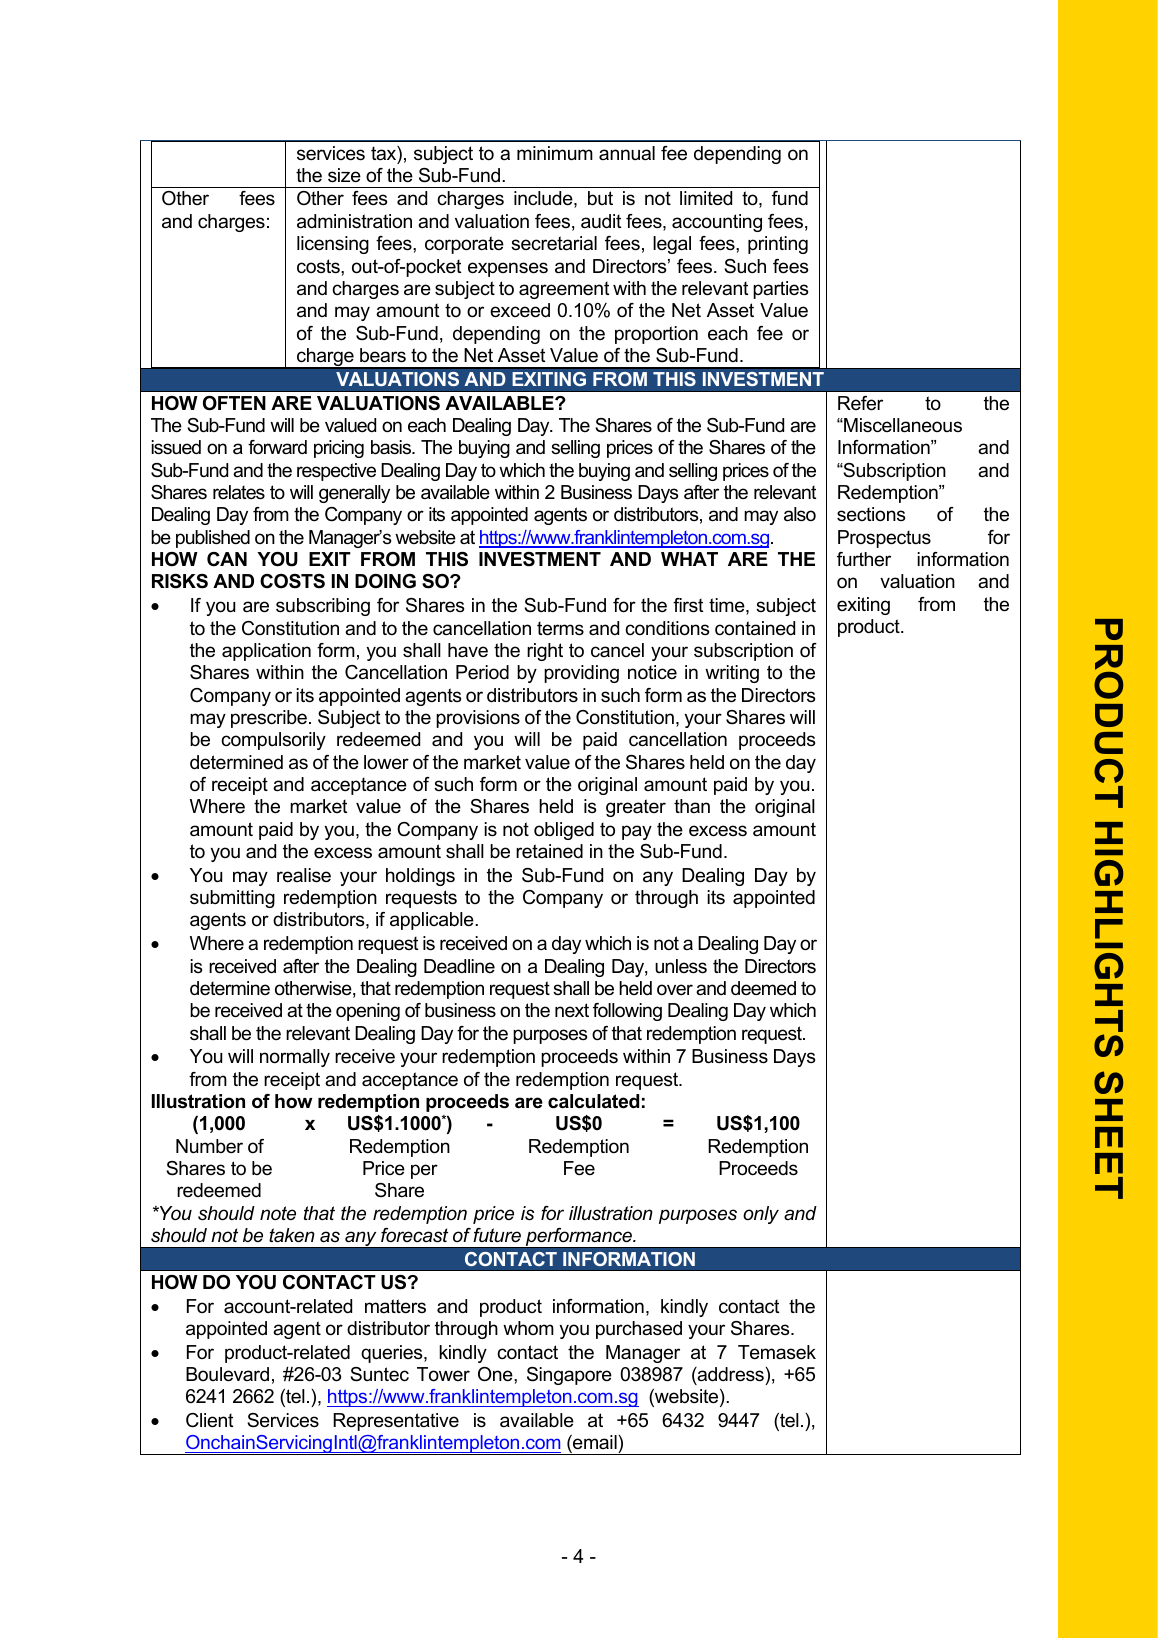
Page 4 of each Product Highlights Sheet, shown in full. These documents define payment windows, not measured processing times. Open a page to inspect its complete clauses.
These are documented payment windows, not measured execution times. Seven days is not an observed average; one day is not a guarantee under every stress condition. We cannot conclude that the tokenized fund normally takes six extra days. We can conclude that the reviewed terms provide no stronger direct-redemption timing commitment.
For a treasury that must pay a supplier in bank dollars, there are three economically distinct routes:
| Route | What changes hands? | What makes the payment possible? |
|---|---|---|
| Fund redemption | Shares are cancelled for proceeds | Fund processing and cash delivery |
| Sale or transfer to a counterparty | An existing holding changes owner | A willing, eligible recipient and an acceptable settlement asset |
| Collateral borrowing | The holding supports a loan | A lender, collateral acceptance and borrowing capacity |
The second route can avoid waiting for the fund by transferring the waiting period to a buyer. The third finances that period. Neither removes the economic cost of supplying cash. A claim of instant liquidity must identify who supplies it, in what currency, at what size and price.
The endpoint is decisive. A token or stablecoin that cannot satisfy a bank-dollar invoice still requires conversion and payout. Conversely, if an existing obligation can be settled directly with the fund token, redemption may be unnecessary. Our base-case treasury therefore measures time until the required payment can be completed, rather than time until a blockchain transaction confirms.
3. Distribution costs can dominate the return
The same-date factsheets provide a useful check on the economics of a short holding period:
A small return gap.
A large distribution effect.
Before sales charge
3 bp return gap
After illustrated sales charge
104 bp return gap
| Three months ending July 31, 2026 | Tokenized A (acc) USD | Conventional A (acc) USD |
|---|---|---|
| Return net of fund fees, before sales charge | 0.89% | 0.92% |
| Published return after sales charge | -0.12% | 0.92% |
| Sales charge used in that calculation | 1% | 0% |
These are manager-published historical returns, rounded to two decimals, not forecasts or executable quotes. The tokenized factsheet applies a 1% initial sales charge; the conventional factsheet applies zero. [2] [3]
Verify the original return tablesFranklin Templeton · 2 factsheets · July 31, 2026
The sales charge is visible in the original tables
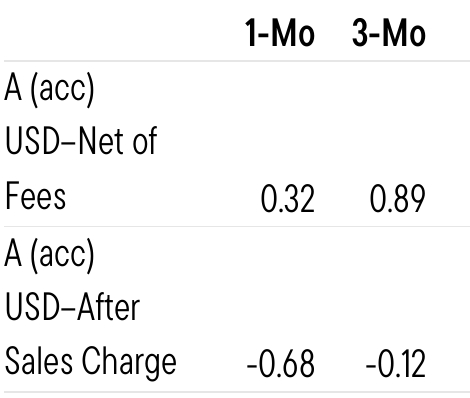
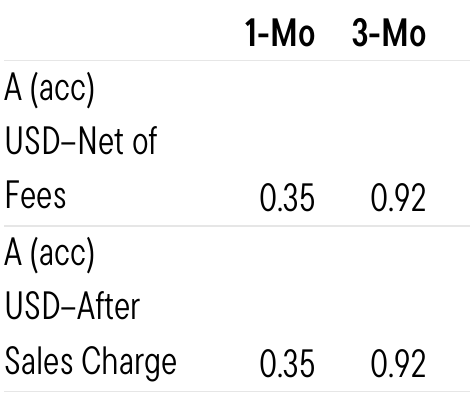
Selected 1-month and 3-month columns from the July 31, 2026 factsheets, page 1. Figures are percentages. The after-sales-charge rows apply 1% for the tokenized class and 0% for the conventional class. Historical performance is not a forecast.
Before that charge, the difference is just three basis points for the quarter. After the displayed charge, it is 104 basis points. The observation does not show that blockchain reduced investment performance. It shows that the investor's distribution terms can matter far more than the small return difference between the portfolios. A waived charge changes that comparison immediately.
The tokenized Product Highlights Sheet allows a subscription fee of up to 1% from June 7, 2026 and notes potential additional distributor charges. This is a published allowance, not proof that every buyer pays the maximum. [5] The conventional sheet lists Class A's current entry charge at zero, with a higher permitted maximum. [4] The economically relevant input is the quote for the investor's actual channel and share class.
Recurring charges also require care. The July factsheets show a 0.20% total expense ratio for the tokenized class and a 0.25% ongoing charges figure for the conventional class. The newer fund's factsheet allows an estimate when fewer than 12 months of history are available. These figures exclude some costs and do not establish a permanent five-basis-point advantage. [2] [3]
For the historical return comparison above, fund expenses are already reflected in performance. Subtracting the displayed expense ratios again would double-count them. For forward economics, the model below uses an assumed net carry difference, with incremental transaction and service costs handled separately.
4. How many days are worth paying for?
Consider USD 1 million that can earn an additional 4% per year instead of sitting in a zero-yield balance. If tokenization genuinely keeps that whole amount productive for three extra calendar days, the incremental income is:
USD 1,000,000 × 4% × 3 / 365 = USD 328.77.
That is 3.29 basis points of principal. This is a scenario, not a measured advantage of either fund. The 4% input is a net opportunity-cost assumption, not a quoted yield. If the alternative cash balance earns 2%, while the productive balance earns 4%, the relevant difference is 2% and the benefit halves.
Let P be the affected principal, r the annual net carry difference, d the calendar days of idle time avoided, and f the incremental one-time cost as a fraction of that principal. The timing-only benefit is P × (r × d / 365 − f). The break-even number of days is 365 × f / r when r is positive.
The fee sets the required time saving
Calendar days needed at 4% annual net carry difference
Panasia scenario calculations · Not observed product performance
Figure 1. One-time incremental fee divided by the value of an additional productive day. Assumed net carry difference: 4% per year; simple ACT/365. Panasia calculations.
At the assumed 4% carry difference, a ten-basis-point incremental charge requires 9.13 days of additional productive use. A 100-basis-point charge requires 91.25 days. A three-day improvement cannot cover either hurdle on timing income alone. If no idle time is removed, this component of value is zero even when the transfer itself is fast.
| Calendar days of idle time avoided | Value at 2% net carry | Value at 4% net carry | Value at 6% net carry |
|---|---|---|---|
| 1 | USD 54.79 | USD 109.59 | USD 164.38 |
| 3 | USD 164.38 | USD 328.77 | USD 493.15 |
| 7 | USD 383.56 | USD 767.12 | USD 1,150.68 |
| 30 | USD 1,643.84 | USD 3,287.67 | USD 4,931.51 |
Panasia calculations on USD 1 million, simple ACT/365 accrual, before incremental transaction and service charges. These are calendar days of additional productive use, not fund settlement promises.
This comparison is deliberately favourable to the tokenized route: it assumes the affected cash would otherwise earn nothing at the 4% setting, is entirely deployable, and can be used for the required payment at the end. Conversion spreads, market impact and operating costs reduce the available budget. Avoided failed-payment penalties or operational labour can increase total value, but must be added as separate, evidenced benefits.
Repeated use changes the economics
A one-time setup or acquisition fee can be amortised over many uses of the same holding. A per-transfer fee cannot. Distinguishing those two cost types is essential for a treasury product.
Assume the same USD 1 million pool avoids three idle days each month, for 12 non-overlapping cycles. At a 4% carry difference, using the entire pool each time creates USD 3,945.21 of annual gross benefit. If only one quarter of the pool is needed in those cycles, the benefit falls to USD 986.30. That is the maximum annual budget for all incremental costs before the timing benefit disappears.
Utilisation limits the annual cost budget
Annual gross benefit in basis points of the entire cash pool
Panasia scenario calculations · Not observed product performance
Figure 2. Annual gross benefit before additional costs, with three saved days per month over twelve non-overlapping cycles. Assumed net carry difference: 4% per year. Utilisation is the share of the cash pool used in each cycle. Panasia calculations.
The annual benefit is P × utilisation × r × days per cycle × cycles / 365. The model assumes a constant pool, simple accrual and no overlap between saved periods. It is not trading volume: moving the same token repeatedly does not multiply income unless it removes distinct periods of idle cash.
This produces a practical product-design threshold. Under the quarter-utilisation scenario, a ten-basis-point annual platform charge on the whole USD 1 million pool costs USD 1,000 and exceeds the USD 986 benefit before any transfer charges. An identical technology priced per actively used balance could have different economics. The relevant adoption metric is productive balance-days added, rather than gross token transfer volume.
5. Collateral creates financing capacity, with a price
An additional use for a money-fund token is already described in a specific Asian distribution context. In February 2026, DigiFT and Secured Finance announced that eligible users could pledge DigiFT-acquired UBS uMINT to access supported on-chain liquidity, including USDC and JPYC, subject to eligibility and platform terms. This is an integration announcement; it does not disclose a financing-volume history or a universal borrowing quote. It also does not establish collateral acceptance for the Franklin fund examined above. [8]
A named route from fund holdings to financing
DigiFT’s original announcement graphic, February 5, 2026. The reported integration concerns eligible uMINT collateral on Secured Finance; it does not establish a lending route for the Franklin fund.
The mechanism deserves its own calculation. Assume an eligible investor holds USD 1 million of a qualifying fund token, borrows USD 800,000 at an 80% loan-to-value ratio, earns 4% net on the fund, and pays 6% annual interest on a three-day loan. All rates, the loan-to-value ratio and the loan's availability here are hypothetical.
| Three-day bridge calculation | Amount |
|---|---|
| Interest on USD 800,000 at 6% | USD 394.52 |
| Fund income retained on the USD 800,000 that would otherwise be redeemed, at 4% | USD 263.01 |
| Incremental financing cost versus redeeming that amount | USD 131.51 |
Panasia calculations, simple ACT/365, excluding transaction charges, conversion, collateral haircuts beyond the assumed loan-to-value ratio and liquidation costs.
Crediting income on the entire USD 1 million against the loan would misstate the incremental benefit: the USD 200,000 not needed for payment could stay invested under either route. The correct comparison retains income only on the amount that would otherwise be sold.
Borrowing can still be useful when redemption cannot meet a deadline. The USD 131.51 is then a price for earlier financing, not evidence of free liquidity. A conventional credit line at the same effective rate and speed would provide the same financial service; the tokenized route must improve access, operational execution or total cost to win the comparison.
Collateral also commits more assets than the cash raised. The hypothetical USD 800,000 loan encumbers USD 1 million, and a lender may require more collateral or liquidate after a valuation change. Repayment needs its own cash source. A product that solves today's payment by creating an unplanned future funding need has shifted the problem, even if the initial transaction worked perfectly.
6. Where the evidence supports adoption
For the defined treasury, the conventional fund remains a demanding benchmark. The reviewed pair does not establish a reason to pay a tokenization premium for ordinary fund holding and direct bank-cash redemption. This is a conclusion about the evidence and use case, not a universal ranking of tokenized funds.
| Treasury requirement | Economic test | Assessment from this study |
|---|---|---|
| Hold USD cash and redeem for a scheduled bank payment | Net return, actual charge and usable-cash deadline | No demonstrated token-specific advantage in the reviewed pair |
| Settle an obligation with a recipient that accepts the fund token | Avoided idle balance-days and operating cost exceed incremental fees | Plausible benefit; requires an actual accepting route |
| Obtain funding before redemption can complete | All-in bridge cost beats available financing alternatives | Mechanism evidenced separately for eligible uMINT users; rates and capacity remain transaction-specific |
| Invest a small starting balance | Available product and channel minimums | The USD 20 published minimum addresses an access need absent from our USD 1 million case [1] |
The strongest case for tokenized money funds is therefore a recurring workflow in which investment exposure stays useful between investment and payment. Its economics depend on counterparties and utilisation. Merely putting a fund in a wallet does not demonstrate either.
Our assessment would change with evidence that an eligible user can complete a specified payment sooner at a competitive all-in price. A useful validation would record the same payment amount and endpoint across both routes, capturing order acceptance, usable-cash arrival, itemised charges and any failed attempts. Repeated observations around cutoffs and non-business days would distinguish a dependable service from a favourable demonstration.
For providers, the implication is concrete: price the workflow against the capital it releases, publish executable exit and collateral terms, and measure saved balance-days. For researchers, the burden is equally clear: an adoption claim needs a counterfactual with the same payment endpoint. That is the difference between documenting tokenization and demonstrating its value.
Method and boundaries
Sources were reviewed on September 12, 2026. Product terms come from the named Singapore disclosure sheets; the return comparison uses both A (acc) USD factsheets dated July 31, 2026. The sample is purposive and limited to one manager's two products. No authenticated investment, redemption or borrowing was conducted, and provider-reported figures have not been independently audited. The source register identifies document locations and distinguishes published terms, reported performance and Panasia scenarios.
The downloadable model uses simple ACT/365, USD and unrounded intermediate values. Displayed outputs are rounded to two decimals; one basis point equals 0.01%. The timing model assumes otherwise comparable exposure and a positive net carry difference. It omits compounding, tax, changes in NAV and unquoted service costs; those exclusions make its output a budget for additional costs, not an investable return forecast. The comparison does not remove the funds' capital risk. Conclusions apply to the defined workflow and change when access, charges, endpoints or financing alternatives change.
References
[1] Franklin Templeton. MAS approval and the comparable investment objectives. May 15, 2025. Product design, Singapore VCC and USD 20 minimum.
[2] Franklin Templeton. OnChain U.S. Dollar Short-Term Money Market Fund, A (acc) USD: factsheet. July 31, 2026. Page 1: identifiers, charges and returns; page 2: expense-ratio definition.
[3] Franklin Templeton. U.S. Dollar Short-Term Money Market Fund, A (acc) USD: factsheet. July 31, 2026. Page 1: identifiers, charges and returns; page 2: ongoing-charge definition.
[4] Franklin Templeton. Conventional fund: Product Highlights Sheet. Prepared May 29, 2026. Pages 3-4: fees, sale proceeds, cutoff and dealing calendar.
[5] Franklin Templeton. OnChain fund: Product Highlights Sheet. Prepared May 12, 2026. Pages 1, 3-5: register, subscription fee change, redemption and definitions.
[6] Franklin Templeton. Valuation Day definition notice. January 2024. Reviewed alongside the conventional fund's subsequent Product Highlights Sheet; the USD fund calendar remains tied to NYSE business days. Used for the source-register calendar check.
[7] Marketnode. Appointment to distribute Franklin Templeton's OnChain money fund. March 31, 2026. Authorised distribution announcement; not a secondary-liquidity commitment.
[8] DigiFT / Secured Finance. DigiFT-distributed tokenized assets as eligible collateral. February 5, 2026. uMINT integration, supported liquidity assets and eligibility conditions.
Research materials
Working paper · Version 3.0 · Public-source analysis
Download PDF ↗Download case register (CSV) ↓Download calculations (CSV) ↓Download sources and model assumptions (JSON) ↓